Computes the fit of a given admixturegraph from f2-statistics. Drift edge weights and admixture edges weights are optimized until the (negative) likelihood score is minimized. The likelihood score is based on the squared difference between estimated and fitted f3-statistics.
qpgraph(
  data,
  graph,
  lambdascale = 1,
  boot = FALSE,
  diag = 1e-04,
  diag_f3 = 1e-05,
  lsqmode = FALSE,
  numstart = 10,
  seed = NULL,
  cpp = TRUE,
  return_fstats = FALSE,
  return_pvalue = FALSE,
  f3precomp = NULL,
  f3basepop = NULL,
  constrained = TRUE,
  allsnps = FALSE,
  ppinv = NULL,
  f2_blocks_test = NULL,
  verbose = FALSE
)
Arguments
- data
Input data in one of three forms:
A 3d array of blocked f2 statistics, output of
f2_from_precomporextract_f2(fastest option)A directory which contains pre-computed f2-statistics
The prefix of genotype files (slowest option)
- graph
An admixture graph represented as a matrix of edges, an
igraphobject, or the path to a qpGraph graph file. Edges can be constrained by providing a matrix or data frame of edges with columns titledlowerandupperwith lower and upper bounds, respectively. By default, admixture edges are constrained to be between zero and one (with paired edges summing to one), and drift edges have a lower bound at zero.- lambdascale
Scales f2-statistics. This has no effect on the fit, but is used in the original qpGraph program to display branch weights on a scale that corresponds to FST distances.
- boot
If
FALSE(the default), each block will be left out at a time and the covariance matrix of f3 statistics will be computed using block-jackknife. Otherwise bootstrap resampling is performedntimes, wherenis either equal tobootif it is an integer, or equal to the number of blocks ifbootisTRUE. The covariance matrix of f3 statistics will be computed using bootstrap resampling.- diag
Regularization term added to the diagonal elements of the covariance matrix of fitted branch lengths (after scaling by the matrix trace). Default is 0.0001.
- diag_f3
Regularization term added to the diagonal elements of the covariance matrix of estimated f3 statistics (after scaling by the matrix trace). In the original qpGraph program, this is fixed at 0.00001.
- lsqmode
Least-squares mode. If
TRUE, the likelihood score will be computed using a diagonal matrix with1/(sum(diag(f3_var)) * diag_f3), in place of the inverse f3-statistic covariance matrix.lsqmode = 2will use the identity matrix instead, which is equivalent to computing the score as the sum of squared residuals (sum((f3_est-f3_fit)^2)).Both of these options do not take the covariance of f3-statistics into account. This can lead to bias, but is more stable in cases where the inverse f3-statistics covariance matrix can not be estimated precisely (for example because the number of populations is large). An alternative to
lsqmode = TRUEthat doesn't completely ignore the covariance of f3-statistics is to increasediag_f3.- numstart
Number of random initializations of starting weights. Defaults to 10. Increasing this number will make the optimization slower, but reduce the risk of not finding the optimal weights. Check the
optoutput to see how much the optimization depends on the starting weights.- seed
Random seed for generating starting weights.
- cpp
Use C++ functions. Setting this to
FALSEwill be slower but can help with debugging.- return_fstats
Return estimated and fitted f2- and f4-statistics, as well as the worst f4-statistic residual Z-score. Defaults to
FALSEbecause this can be slow.- f3precomp
Optional precomputed f3-statistics. This should be the output of
qpgraph_precompute_f3and can be provided instead ofdata. This can speed things up if many graphs are evaluated using the same set of f3-statistics.- f3basepop
Optional f3-statistics base population. Inference will be based on f3-statistics of the form
f3(f3basepop; i, j)for all population pairs(i, j). Defaults to the outgroup population if the graph has one. This option is ignored iff3precompis provided. Changingf3basepopshould make very little difference.- constrained
Constrain estimated drift edge weights to be non-negative, and admixture edge weights to be between zero and one.
- allsnps
Compute f3 from different SNPs for each population triplet (if data is missing for some SNPs and populations). This only has an effect when
datais the prefix of genotype files.- ppinv
Optional inverse f3-statistics covariance matrix
- f2_blocks_test
An optional 3d array of f2-statistics used for computing an out-of-sample score. This should contain only SNP blocks which are not part of
f2_blocks. This allows to estimate the fit of a graph without overfitting and will not be used during the optimization step- verbose
Print progress updates
Value
qpgraph returns a list with data describing the model fit:
edges: A data frame where each row is an edge in the graph. For regular edges, the columnweightis the estimated edge length, and for admixture edges, it is the estimated admixture weight.score: The likelihood score of the fitted graph. Lower values correspond to better fits. The score is calculated as the inner product of the residuals (difference between estimated and fitted f3 statistics), weighted by the inverse of the f3 covariance matrix. Seeqpgraph_scoref2: Estimated and fitted f2 statistics (ifreturn_fstats = TRUE). p-values and z-scores test the significance of the difference.f3: Estimated and fitted f3 statistics. p-values and z-scores test the significance of the difference.f4: Estimated and fitted f4 statistics (ifreturn_fstats = TRUE). p-values and z-scores test the significance of the difference.opt: A data frame with details of the weight-fitting step, including the randomly sampled starting weights. The columnvaluecontains the score for each set of starting weights. Columns starting withxdenote initial weights, and columns starting withydenote fitted weights.worst_residual: The highest absolute z-score of f4-statistics residuals (fitted - estimated f4); (returned ifreturn_fstats = TRUE)
References
Patterson, N. et al. (2012) Ancient admixture in human history. Genetics
See also
qpgraph_wrapper for a wrapper functions which calls the original qpGraph program.
Examples
out = qpgraph(example_f2_blocks, example_graph)
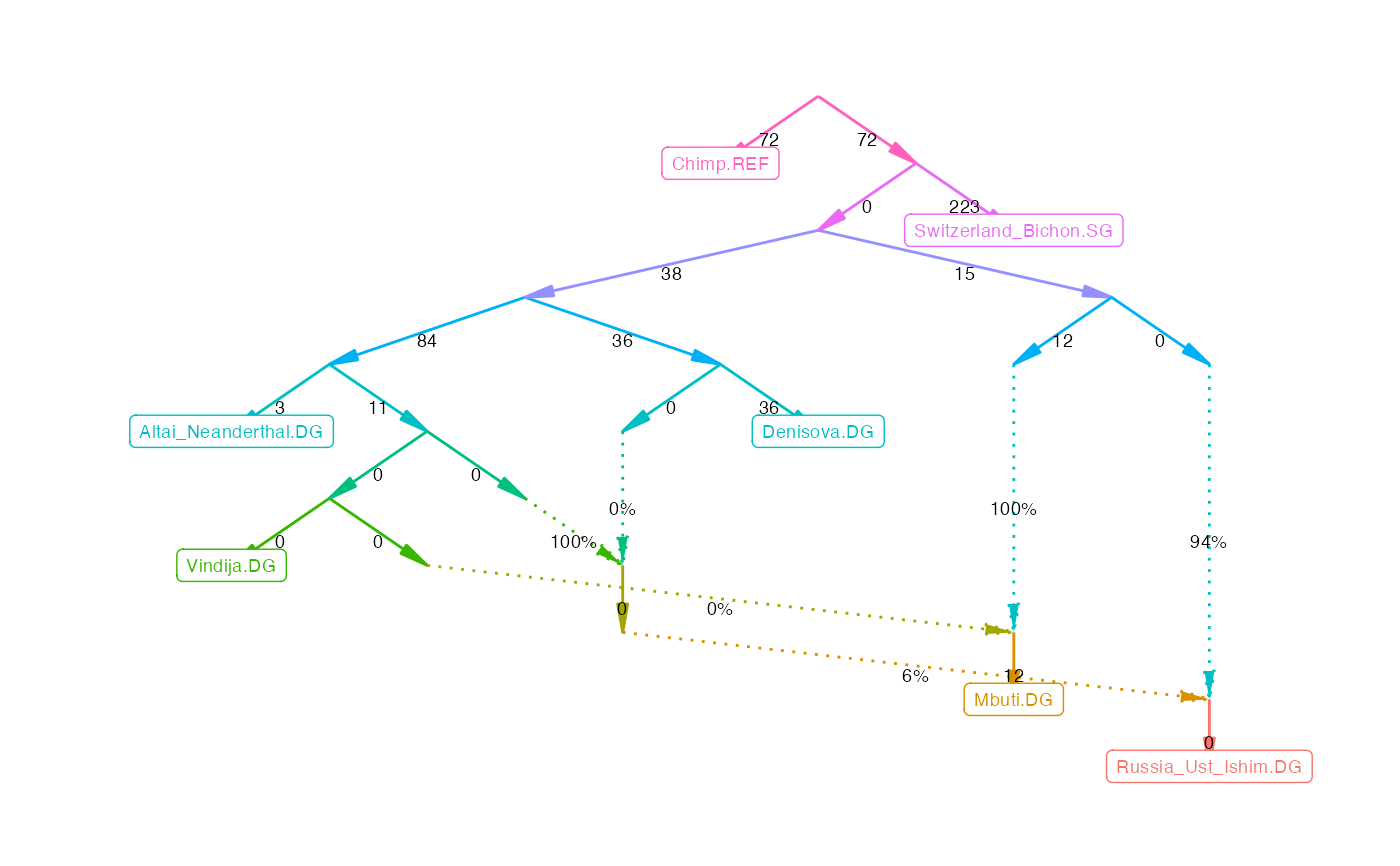
plot_graph(out$edges)